Visualization
This will only work in HTML format, else the definition is displayed.
All of the visual effects allow the use of additional style settings as the last argument.
CoffeeScript Code report = new Report()
report.qr "http://alinex.de", '.right'This will be written in markdown as:
Markdown Document $$$ qr {.right}http://alinex.de$$$
Which will add a float: right style setting to the element.
QR Code
QR Codes are used to pack some information into a scanable 2D Object.
Simple Code
You only need to give the content like an URL:
CoffeeScript Code report = new Report()
report.qr "http://alinex.de"This will be written in markdown as:
Markdown Document $$$ qrhttp://alinex.de$$$
And finally in HTML and text or console output:


QR Extended
You may also define how to make the code image:
CoffeeScript Code report = new Report()
report.qr
content: 'http://alinex.github.io'
padding: 1
width: 500
height: 500
color: '#ff0000'
background: '#ffffff'
ecl: 'M'Markdown Document $$$ qrcontent: 'http://alinex.github.io'padding: 1width: 500height: 500color: '#ff0000'background: '#ffffff'ecl: M$$$
And finally in HTML and text or console output:


Charts
A lot of charts are possible based on jui-chart. You’ll find all possible settings there or look at some of the examples below.
CoffeeScript Code report = new Report()
report.chart null, [
['quarter', 'sales', 'profit']
["1Q", 50, 35]
["2Q", 20, 100]
["3Q", 10, 5]
["4Q", 30, 25]
]This makes a simple bar chart with predefined settings for your data. But you may also specify a lot of options and charts. The examples below shows the possible settings, but you only need to give some of them.
Markdown Document $$$ chart| quarter | sales | profit ||:------- |:----- |:------ || 1Q | 50 | 35 || 2Q | 20 | 100 || 3Q | 10 | 5 || 4Q | 30 | 25 |$$$
This will render in HTML as (click to show in browser):

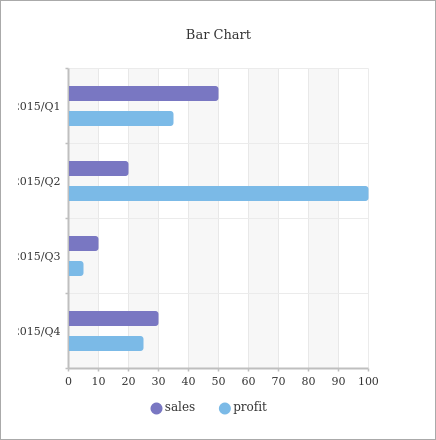
Bar Chart
CoffeeScript Code report = new Report()
report.chart
width: 400
height: 400
axis:
y:
type: 'block'
domain: 'quarter'
line: 'true'
x:
type: 'range'
domain: 'profit'
line: 'rect' # dashed with gradient
brush: [
type: 'bar'
size: 15
target: ['sales', 'profit']
innerPadding: 10
]
widget: [
type: 'title'
text: 'Bar Chart'
,
type: 'legend'
,
type: 'tooltip'
]
, [
['quarter', 'sales', 'profit']
["2015/Q1", 50, 35]
["2015/Q2", 20, 100]
["2015/Q3", 10, 5]
["2015/Q4", 30, 25]
]Markdown Document $$$ chart
width: 400
height: 400
axis:
'y':
type: block
domain: quarter
line: 'true'
x:
type: range
domain: profit
line: rect
brush:
- type: bar
size: 15
target:
- sales
- profit
innerPadding: 10
widget:
- type: title
text: Bar Chart
- type: legend
- type: tooltip
| quarter | sales | profit |
|:------- |:----- |:------ |
| 2015/Q1 | 50 | 35 |
| 2015/Q2 | 20 | 100 |
| 2015/Q3 | 10 | 5 |
| 2015/Q4 | 30 | 25 |
$$$
This will render in HTML as (click to show in browser):
3D Bar Chart
CoffeeScript Code report = new Report()
report.chart
width: 400
height: 400
axis:
x:
type: 'range'
domain: 'profit'
step: 5
y:
type: 'block'
domain: 'quarter'
c:
type: 'grid3d'
domain: ['sales', 'profit']
depth: 20
degree: 30
brush: [
type: 'bar3d'
outerPadding: 10
innerPadding: 5
]
widget: [
type: 'title'
text: '3D Bar Chart'
,
type: 'tooltip'
,
type: 'legend'
]
, [
['quarter', 'sales', 'profit']
["2015/Q1", 50, 35]
["2015/Q2", 20, 100]
["2015/Q3", 10, 5]
["2015/Q4", 30, 25]
]The markdown will contain the settings and the data table like above.
This will render in HTML as (click to show in browser):
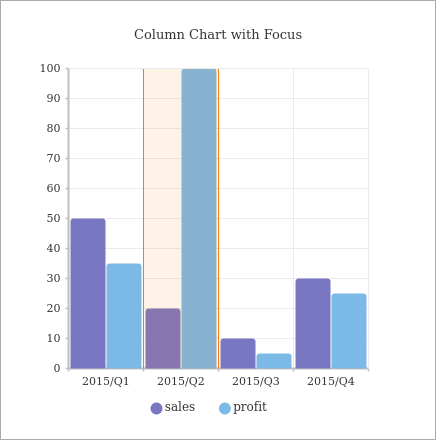
Column Chart
CoffeeScript Code report = new Report()
report.chart
width: 400
height: 400
axis:
x:
type: 'block'
domain: 'quarter'
y:
type: 'range'
domain: 'profit'
step: 10
line: true
brush: [
type: 'column'
target: ['sales', 'profit']
,
type: 'focus'
start: 1
end: 1
]
widget: [
type: 'title'
text: 'Column Chart with Focus'
,
type: 'tooltip'
,
type: 'legend'
]
, [
['quarter', 'sales', 'profit']
["2015/Q1", 50, 35]
["2015/Q2", 20, 100]
["2015/Q3", 10, 5]
["2015/Q4", 30, 25]
]The markdown will contain the settings and the data table like above.
This will render in HTML as (click to show in browser):
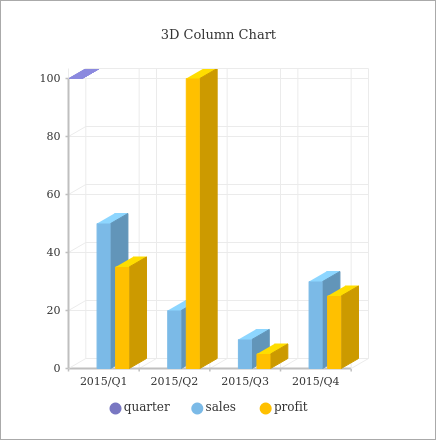
3D Column Chart
CoffeeScript Code report = new Report()
report.chart
width: 400
height: 400
axis:
x:
type: 'block'
domain: 'quarter'
y:
type: 'range'
domain: 'profit'
step: 5
c:
type: 'grid3d'
domain: ['sales', 'profit']
depth: 20
degree: 30
brush: [
type: 'column3d'
outerPadding: 10
innerPadding: 5
]
widget: [
type: 'title'
text: '3D Column Chart'
,
type: 'tooltip'
,
type: 'legend'
]
, [
['quarter', 'sales', 'profit']
["2015/Q1", 50, 35]
["2015/Q2", 20, 100]
["2015/Q3", 10, 5]
["2015/Q4", 30, 25]
]The markdown will contain the settings and the data table like above.
This will render in HTML as (click to show in browser):
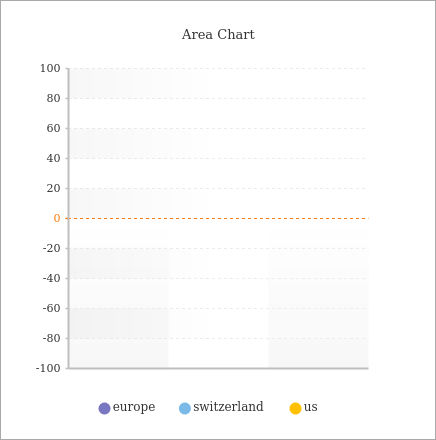
Area Chart
CoffeeScript Code report = new Report()
report.chart
width: 400
height: 400
axis:
x:
type: 'fullblock'
domain: 'year'
line: 'solid gradient'
y:
type: 'range'
domain: [-100, 100]
step: 10
line: 'gradient dashed'
brush: [
type: 'area'
symbol: 'curve'
target: ['europe', 'switzerland', 'us']
]
widget: [
type: 'title'
text: 'Area Chart'
,
type: 'legend'
]
, [
['quarter', 'sales', 'profit']
["2015/Q1", 50, 35]
["2015/Q2", 20, 100]
["2015/Q3", 10, 5]
["2015/Q4", 30, 25]
]The markdown will contain the settings and the data table like above.
This will render in HTML as (click to show in browser):
PlantUML
A language to describe UML diagrams using simple text, which fits perfectly into markdown. See plantuml.com for a complete language description. Some examples will follow:
CoffeeScript Code report = new Report()
report.plantuml "A -> B: Hello"This sumple sequence diagram will be written into execution tags in markdown like:
Markdown Document $$$ plantumlA -> B: Hello$$$
And finally this will render in HTML or text/console as:
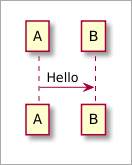
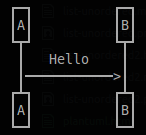
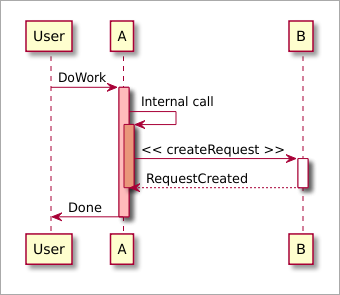
Sequence Diagram
CoffeeScript Code report = new Report()
report.plantuml """
participant User
User -> A: DoWork
activate A #FFBBBB
A -> A: Internal call
activate A #DarkSalmon
A -> B: << createRequest >>
activate B
B --> A: RequestCreated
deactivate B
deactivate A
A -> User: Done
deactivate A
"""The markdown is nearly the same but with $$$ plantuml .... $$$ arround the code.
And this will render in HTML or text/console as:
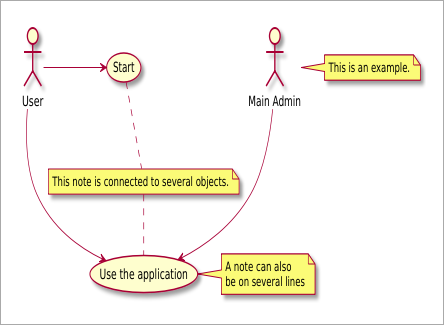
Use Case Diagram
CoffeeScript Code report = new Report()
report.plantuml """
:Main Admin: as Admin
(Use the application) as (Use)
User -> (Start)
User --> (Use)
Admin ---> (Use)
note right of Admin : This is an example.
note right of (Use)
A note can also
be on several lines
end note
note "This note is connected to several objects." as N2
(Start) .. N2
N2 .. (Use)
"""The markdown is nearly the same but with $$$ plantuml .... $$$ arround the code.
And in HTML this will look like:
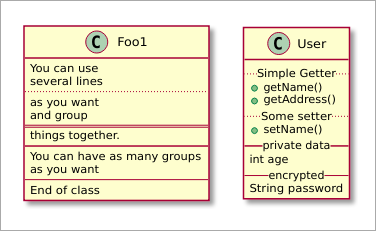
Class Diagram
CoffeeScript Code report = new Report()
report.plantuml """
class Foo1 {
You can use
several lines
..
as you want
and group
==
things together.
__
You can have as many groups
as you want
--
End of class
}
class User {
.. Simple Getter ..
+ getName()
+ getAddress()
.. Some setter ..
+ setName()
__ private data __
int age
-- encrypted --
String password
}
"""The markdown is nearly the same but with $$$ plantuml .... $$$ arround the code.
And in HTML this will look like:
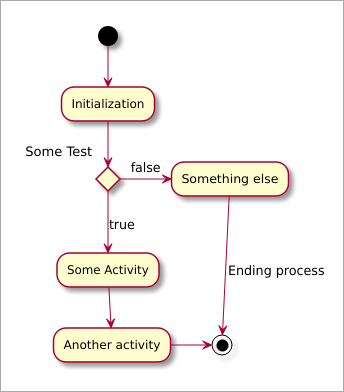
Activity Diagram (old syntax)
CoffeeScript Code report = new Report()
report.plantuml """
(*) --> "Initialization"
if "Some Test" then
-->[true] "Some Activity"
--> "Another activity"
-right-> (*)
else
->[false] "Something else"
-->[Ending process] (*)
endif
"""The markdown is nearly the same but with $$$ plantuml .... $$$ arround the code.
And in HTML this will look like:
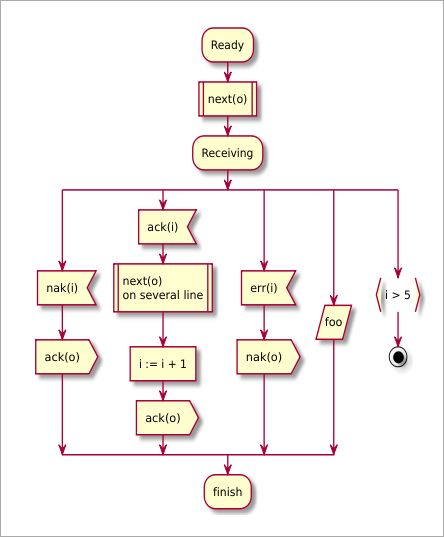
Activity Diagram (new syntax)
CoffeeScript Code report = new Report()
report.plantuml """
:Ready;
:next(o)|
:Receiving;
split
:nak(i)<
:ack(o)>
split again
:ack(i)<
:next(o)
on several line|
:i := i + 1]
:ack(o)>
split again
:err(i)<
:nak(o)>
split again
:foo/
split again
:i > 5}
stop
end split
:finish;
"""The markdown is nearly the same but with $$$ plantuml .... $$$ arround the code.
And in HTML this will look like:
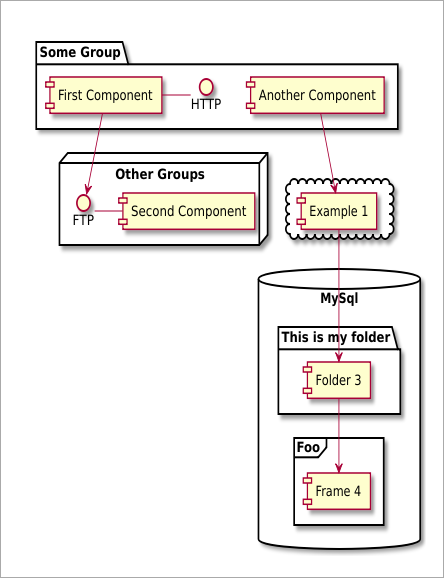
Component Diagram
CoffeeScript Code report = new Report()
report.plantuml """
package "Some Group" {
HTTP - [First Component]
[Another Component]
}
node "Other Groups" {
FTP - [Second Component]
[First Component] --> FTP
}
cloud {
[Example 1]
}
database "MySql" {
folder "This is my folder" {
[Folder 3]
}
frame "Foo" {
[Frame 4]
}
}
[Another Component] --> [Example 1]
[Example 1] --> [Folder 3]
[Folder 3] --> [Frame 4]
"""The markdown is nearly the same but with $$$ plantuml .... $$$ arround the code.
And in HTML this will look like:
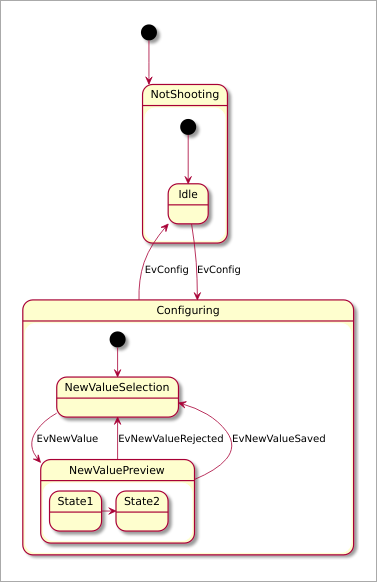
State Diagram
CoffeeScript Code report = new Report()
report.plantuml """
scale 350 width
[*] --> NotShooting
state NotShooting {
[*] --> Idle
Idle --> Configuring : EvConfig
Configuring --> Idle : EvConfig
}
state Configuring {
[*] --> NewValueSelection
NewValueSelection --> NewValuePreview : EvNewValue
NewValuePreview --> NewValueSelection : EvNewValueRejected
NewValuePreview --> NewValueSelection : EvNewValueSaved
state NewValuePreview {
State1 -> State2
}
}
"""The markdown is nearly the same but with $$$ plantuml .... $$$ arround the code.
And in HTML this will look like:
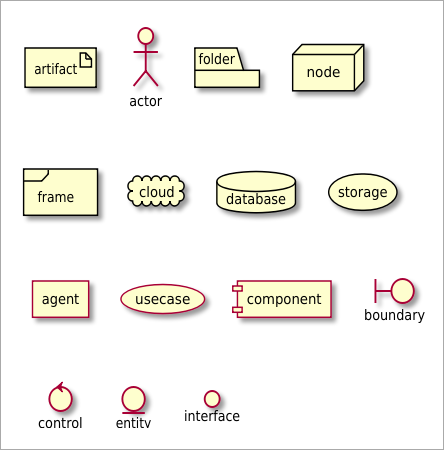
Deployment Diagram
CoffeeScript Code report = new Report()
report.plantuml """
artifact artifact
actor actor
folder folder
node node
frame frame
cloud cloud
database database
storage storage
agent agent
usecase usecase
component component
boundary boundary
control control
entity entity
interface interface
"""The markdown is nearly the same but with $$$ plantuml .... $$$ arround the code.
And in HTML this will look like:
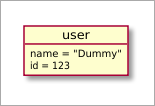
Object Diagram
CoffeeScript Code report = new Report()
report.plantuml """
object user {
name = "Dummy"
id = 123
}
"""The markdown is nearly the same but with $$$ plantuml .... $$$ arround the code.
And in HTML this will look like:
Wireframe
CoffeeScript Code report.plantuml """
salt
{+
{/ <b>General | Fullscreen | Behavior | Saving }
{
{ Open image in: | ^Smart Mode^ }
[X] Smooth images when zoomed
[X] Confirm image deletion
[ ] Show hidden images
}
[Close]
}
"""The markdown is nearly the same but with $$$ plantuml .... $$$ arround the code.
And in HTML this will look like:
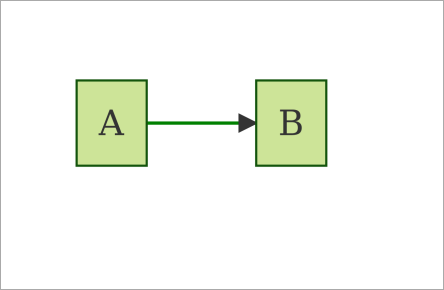
Mermaid
A library for creating flowcharts and diagrams out of text.
CoffeeScript Code report = new Report()
report.mermaid """
graph LR
A-->B
"""This sumple sequence diagram will be written into execution tags in markdown like:
Markdown Document $$$ mermaidgraph LRA-->B$$$
And finally this will render in HTML as:
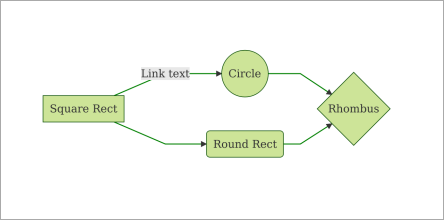
Flowchart
CoffeeScript Code report = new Report()
report.mermaid """
graph LR
A[Square Rect] -- Link text --> B((Circle))
A --> C(Round Rect)
B --> D{Rhombus}
C --> D
"""The markdown is nearly the same but with $$$ mermaid .... $$$ arround the code.
And in HTML this will look like:
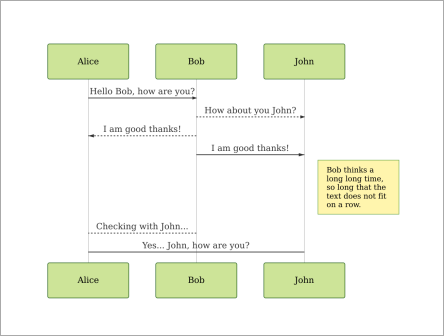
Sequence Diagram
CoffeeScript Code report = new Report()
report.mermaid """
sequenceDiagram
Alice ->> Bob: Hello Bob, how are you?
Bob-->>John: How about you John?
Bob--x Alice: I am good thanks!
Bob-x John: I am good thanks!
Note right of John: Bob thinks a long<br/>long time, so long<br/>that the text does<br/>not fit on a row.
Bob-->Alice: Checking with John...
Alice->John: Yes... John, how are you?
"""The markdown is nearly the same but with $$$ mermaid .... $$$ arround the code.
And in HTML this will look like:
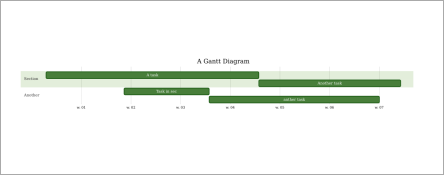
Gantt Diagram
CoffeeScript Code report = new Report()
report.mermaid """
gantt
title A Gantt Diagram
section Section
A task :a1, 2014-01-01, 30d
Another task :after a1 , 20d
section Another
Task in sec :2014-01-12 , 12d
anther task : 24d
"""The markdown is nearly the same but with $$$ mermaid .... $$$ arround the code.
And in HTML this will look like: